


📈 ES Futures Weekly Recap, This Weeks Trade Plans & Outlook – April 13, 2025
Full game plan, recap, and ideas going into Monday

Hello traders!
Due to an extremely busy trading and streaming schedule — along with exciting developments in the works — I haven’t been able to post here as frequently as I’d like.
We’re currently finalizing a new partnership with one of the top futures brokerages in the U.S., which will see us appointed as a strategy leader within their educational ecosystem. This has required some of my free time to be used in setting up the infrastructure in the evenings which is why I’ve had to slow down writing articles for the past couple months which take several hours to write, but Ill have more details on that soon.
For those of you who are still subscribed, I appreciate your patience and urge you to join our futures trading chat room and live stream where I put all of my efforts each day in actively live trading, live streaming, providing daily guidance and recording daily content for our trading group at Livestream Trading to following and learn from.
OK - Let’s catch up on what’s been happening in the ES futures market.
🔁 Weekly Recap: Volatility, Whipsaws, and Headline Chaos
We just wrapped up one of the most challenging weeks from an intraday day trading perspective of the year.
Headline risks, wide candle ranges (tough for managing risk), and wild reversals and swings created the kind of environment that required surgical precision, discipline, and patience.
I’m proud of how we handled the markets last week. Before I get into the game plan for this week, here are some great takeaways from last weeks action:
📅 Monday – The Setup for the Bounce
After Friday’s panic sell-off, the market gapped down Sunday evening into Monday — putting ES roughly 20% down the all time highs.
Warren Buffett once said that it's wise for investors “to be fearful when others are greedy and to be greedy only when others are fearful.”
While this was one of the best long-term dip buying zones we’ve seen in a while on Monday, the intraday action was incredibly volatile to start the week.
Some 5-minute candles ranged from 60 to 150 points, rendering this chart almost untradeable at times for those who focus on smaller time frame day trades in terms of risk management, and while the long bias was confirmed after a failed bear flag and breakdown post-10am, this was a “risk-off” day for day traders due to extreme candle width and volatility as the market worked to build up a stronger edge during the week.
1 HOUR CHART VIEW:

📅 Tuesday – The FOMO Trap
Monday’s short-covering rally carried into Tuesday, but that surge in optimism sparked a wave of emotional FOMO buying, and the market punished it.
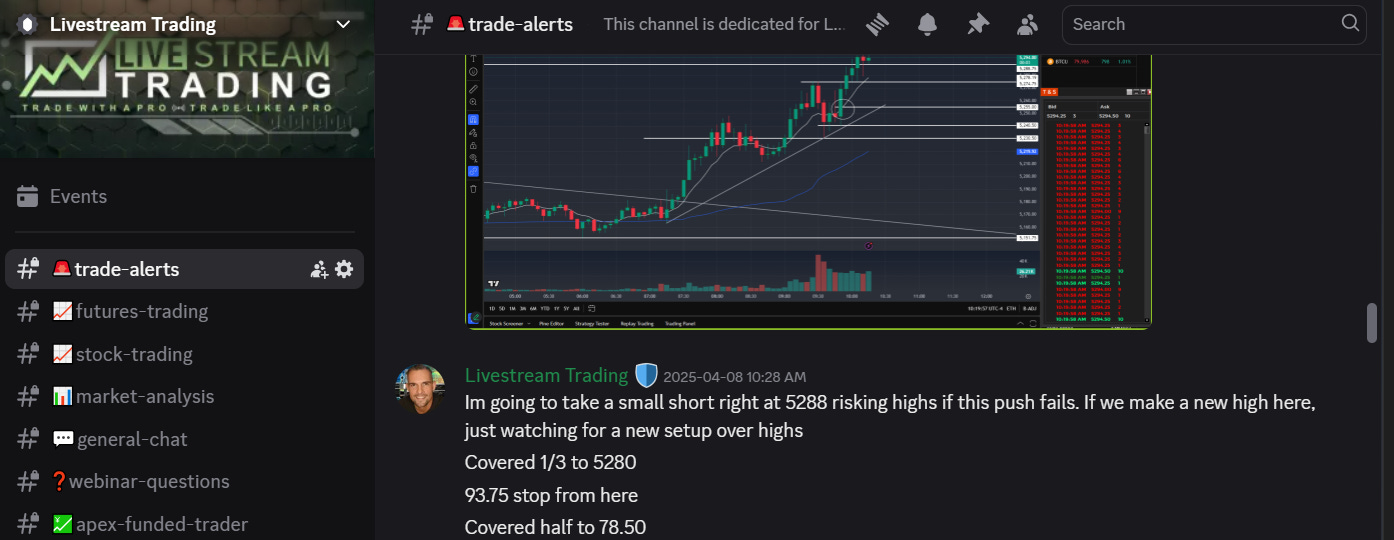
A short setup triggered around 5288 (risking days highs), and confirmed further by triggering a 1HR sell signal at ~5292, led to a full day of downside — taking ES back to test the Sunday/Monday lows. This was a healthy and warranted move to see if the bulls were still defending Sunday and Mondays support zone.
15MIN CHART VIEW:

1 HOUR CHART VIEW:

📅 Wednesday – Multi-Timeframe Long Setup + Trump Tariff Pause
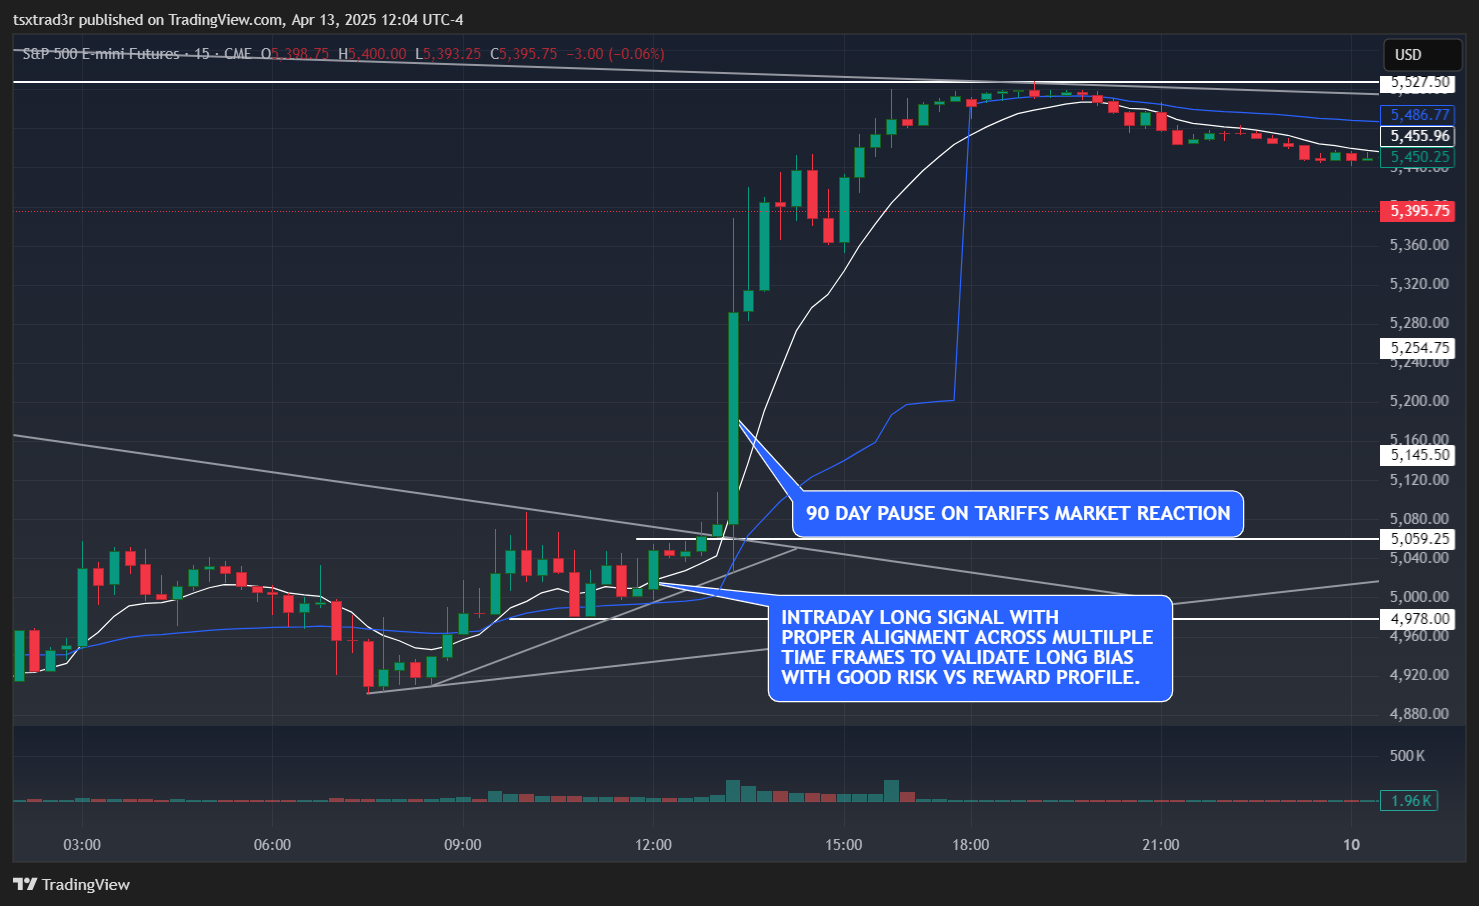
The bulls stepped in again to defend the prior lows in premarket, and for the first time all week, the market aligned across multiple timeframes for a clean long setup — triggering one of the best setups this week, which was a long signal near 5011 risking a mere 13 points which was very tight given the market environment and volatility last week. The key point this week from a day trading perspective was to avoid the noise in the smaller time frames and protect capital until the bigger time frames align a move with good risk vs reward.
Coincidentally, this was also the session where Trump announced a 90-day pause on new tariffs, accelerating the squeeze higher and catching many shorts offside.
15MINUTE CHART INTRA-DAY VIEW ON WEDS:
EXCEPRT FROM LIVE TRADING ROOM CHAT AT LIVESTREAMTRADING.COM

📅 Thursday – Sloppy Action but Strategic Patience
The market rallied hard on Wednesday post tariff news. Price action retraced nearly 50% of the move after the open, and while my bias was leaning towards that dip in the late morning being bought, the market didn’t provide a signal on my end to get involved when it did bounce, and due to extremely high volatility and lack of setups across the bigger and smaller time frames after the bounce, it was a risk-off day until the market aligned better and the market settled a bit to absorb the news and set up for the next move, which would likely be Friday and/or Monday.
We stayed patient and focused, waiting for a cleaner picture — and avoided small-timeframe noise. That patience set us up for stronger conviction on Friday.
15MIN CHART VIEW:

📅 Friday – Bear Trap and Breakout Through 5325.75
After a string of failed breakdown attempts early in the session, ES triggered a 1HR long bias signal through 5325.75, resulting in a clean trend day and strong close into the weekend.
This move ran a wall of stop losses and confirmed a shift in short-term momentum.
1HOUR CHART VIEW:

Full Week Big Picture View with Key Points of Interest (Red circles = short signals, Green circles = long bias signals):

Note that on this week, there was a lot of intraday noise for day traders on smaller time frames. Generally, I get and take setups and signals between the bigger moves, but in this past weeks environment, they were few and far between. Waiting for the bigger time frames to align their setup before entering on a smaller time frame greatly reduces the risk and allows for bigger potential reward when trading in a chaotic environment, such as the one we have been in the past couple weeks.
Key Levels and Scenarios for Next Week
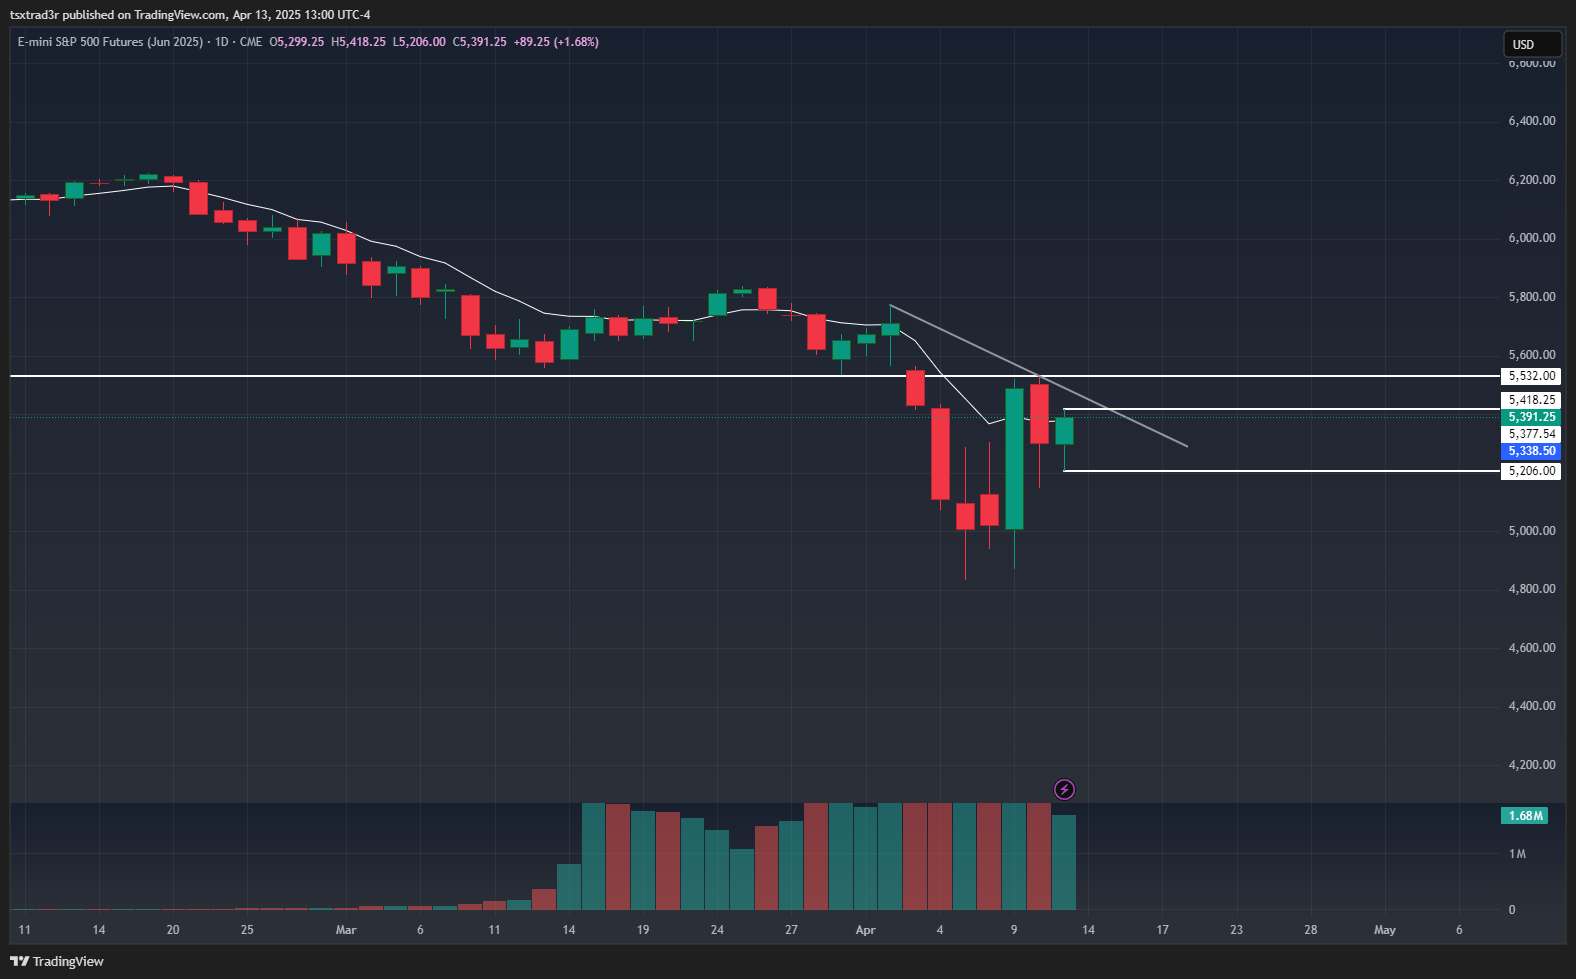
Next week is going to be a very interesting an pivotal week in the market. The 1HR and 4HR charts attempted to break out on Friday, but the daily chart is still in limbo as the bigger time frame players prepare to make their next move:
DAILY CHART VIEW:
Ill provide a bull and bear case for Monday, though which one I trade depends entirely on how the setup looks into 10am Monday morning based on the positioning on the 1HR and 4HR chart time frames, and how high quality the intraday setup is vs the range and volatility we are experiencing.
Bullish Scenario for Monday
A break of Friday’s highs over 5418.25 could trigger shorts on the daily chart time frame to start exiting positions, and potentially entice new buyers to come in giving a chance at a push to re-test major resistance at 5530.

However, its my opinion that big players already positioned themselves for this move buy buying the panic sell / gap down Monday, pre tariff news on Wednesday, and on the Thursday dip buy. Their positions are well cushioned at this point, so new longs coming in at these levels would have to be savvy and careful as those bigger players are likely going to be passively selling obvious bull flags like this.
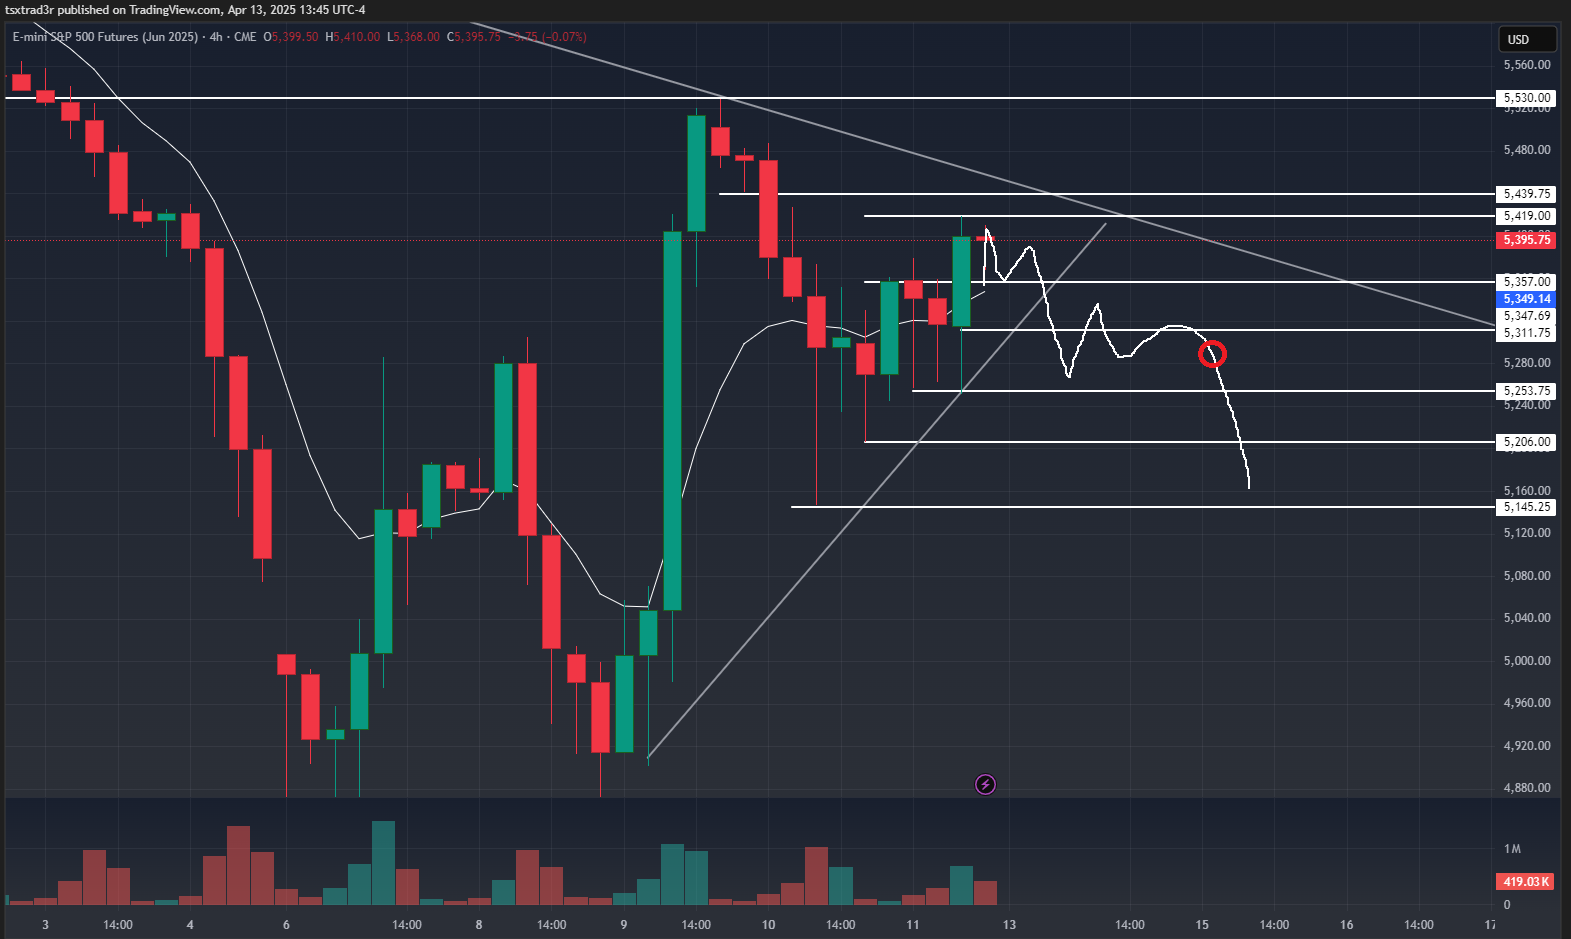
Intraday Monday, my general lean is that if we hold 5360 on Sunday even and Monday morning, and haven’t broken Fridays highs by then, I cautiously default to taking long trades with the trend but only after a failed attempt lower or a multi time frame setup with good risk vs reward. An example, would be a failed breakdown under 5360 that then recovers and sets up a multi day flag on multiple time frames:

In the image and imagined scenario above (1 hour chart view), the sellers try to take it under 5360 breaking the multi day trend line, they recover 5360, and then flag across the 1HR and 4HR chart frames to re-test towards 5540 and/or Weds highs and major resistance at 5530, which would be the ultra bull case for Monday.
4 HOUR CHART VIEW:

The reasoning here is that if the dip holds, shorts will be forced out and longs will take positions on that intraday flag which likely triggers the daily chart to break Fri highs over 5418 which would bring in new buyers and push more shorts out higher.
Again, its likely bigger players are already positioned well before this on Weds pre-news and Thurs in the post news dip that got bought and held, so they may be passive sellers between 5440 - 5530, but it would be a solid, valid setup if met with an intraday setup with good risk vs reward.
In this environment (bear market), I dont buy breakouts unless all time frames align for it and theres clear areas where shorts are trapped and need to exit. This exit liquidity that the shorts provide is where I like to start selling.
For more on this, please see some of our free (for members and free trial users) daily recorded training and recap webinars.
Bearish Scenario for Monday
With Fridays close strong and a break of Fridays highs near by, closing over all moving averages including the daily EMA, my general lean is already long if it provides a setup as detailed above. A bear case would involve a failed flag on Monday that could lead to more selling on Tuesday and Weds:

A loss of 5350 - 5360 and VWAP that ends up becoming resistance would technically get me cautiously looking for confirmations of smaller intraday short bias setups, but Im also more closely monitoring at this time for these pullbacks to be bear traps that recover and flag to complete the daily chart flag in the bull case as mentioned above. I would need to see a lot of conviction on Monday afternoon to start looking at shorts, and this is the kind of chart that would have to be followed live by me to get the real time insights as things unfold. The short side is going to be more tricky this week until the chart gets back into position under 5311 or clearly traps bulls on Monday and reverses. Id be more focused on failed breakdowns and long side on Monday as of now.
Key Levels for This Week:
5360: Thurs and Fri’s Resistance
I want to see this level get tested, broken, and recovered to validate any long setup on Monday for continuation higher. Losing this level and having it become resistance could provide short opportunities intraday, but unless multiple time frames are involved with clear bull traps overhead, short side is cautious on Monday at these levels.
5311: The higher low before the breakout at 5325 on Fri afternoon that started the rally.
Testing under this level doesn’t kill the bulls completely this week; it would be a good place to clear some of the longs from Friday and trap some shorts, but if they do break 5311, its imperative that bulls recover it quickly and then recover 5360 to complete the daily chart breakout, perhaps the following day.
I think this scenario is much less likely (breaking 5311 tomorrow), because the bulls are already in control (unless we get some headlines), but a recovery as drawn here would be VERY bullish for me in the short term going into late Monday or early Tuesday if we recover and hold 5360:

5253: Fridays support and intraday lows
Losing this level is troublesome for bulls and gets us back to looking at short bias trades if the 5311 area becomes resistance. This is an ultra bear case if the bulls somehow drop the ball hard on Monday or get hit with negative news headlines, but losing 5311 and seeing it become resistance builds a good bear case for the rest of the week:
5206: Friday’s Lows and Daily Chart Stop Losses
If the above bear case scenario happened, the target for shorts would be under Friday’s lows, where all the daily chart buyers and dip buyers from Friday would get stopped out providing exit liquidity for shorts.
5145: Thursdays Lows and Risk Level for Thursday’s Mid-Day Dip Buyers
Losing this level would clear out a log of longs from last week and potentially give an opportunity to start looking for bottom bounce / long plays into exhaustion move or continue riding shorts until a trend reversal to the upside.
Final Thoughts and Insights This Week
While my bias remains cautiously long bias for Monday as long as we are holding 5350-5360 on Monday and are still setting up to break Fridays highs, this market continues to reward precision and punish emotional trades.
You can not be chasing moves or breakouts in this environment, and with each day being different than the last in terms of volatility, you have to carefully plan you risk level where some trades may have a 15-20 point stop, while others might call for a 50 point stop or more depending on which time frame you are trading. Proper position sizing is key in this market and overtrading will be punished.
We’ve had clean opportunities — but only when multiple timeframes align. Recognizing when not to trade has been just as powerful as knowing when to strike. That’s what we do best at Livestream Trading, and I hope this blog provides some valuable insights on this as well, when I have a few hours to write.
You know you have a good trading system when it works in all market environments. The beauty of the system I’ve developed is that it allows me to trade in all market environments, but it may give me less trades or triggers when we are in turmoil, like last week, which has kept me safely in the game for 20 years now. If your system is failing you in this market, take a step back until things stabilize again. This is only a temporary market condition - be patient!
⚠️ Reminder for New Readers
These key levels provide a solid game plan heading into the week. But as always, my trading decisions evolve in real time as new 1HR and 4HR chart setups form, and market context shifts. I provide detailed live trading guidance via our daily live trading stream and chat room for the most up-to-date information, live trades, alerts, daily lessons, and daily videos with game plans for each day.
Livestream Trading has always been a small an intimate environment where traders who are serious about learning the markets come to excel. We are not only teaching the technical side of trading, also the psychological side, which is often overlooked, and was required to succeed last week in a market where greed and fear was severely punishing to less patient traders accounts.
If you are looking for live trading guidance, detailed explanations, or just want to get some daily video lessons and video insights for the following trading day, this is the last month we will be offering full access free trials:
🎯 Join Livestream Trading with a 7-day free trial
The market is always changing. The real edge is trading it live, with a team.
P.S. For many people in the risk-off environment we were in last week, it might be more beneficial to use a prop firm to trade futures which limits risk until you are ready to trade your live brokerage accounts again.
You can use coupon code: LIVESTREAM to get the best discount and deal available currently with Apex Trader Funding (or a prop firm of your choice) for access to a funded futures trading account with potential to earn payouts on profits: